Welcome to a tutorial on how to create a simple donut chart using pure HTML and CSS. Want to display a donut chart in your project? But without using complicated third-party libraries? Yes, it is possible to draw one using only HTML CSS – Read on for the example!
TABLE OF CONTENTS
DOWNLOAD & DEMO
Here is the download link to the example code, so you don’t have to copy-paste everything.
EXAMPLE CODE DOWNLOAD
Click here to download | Example on CodePen
Just click on “download zip” or do a git clone. I have released it under the MIT license, so feel free to build on top of it or use it in your own project.
SORRY FOR THE ADS...
But someone has to pay the bills, and sponsors are paying for it. I insist on not turning Code Boxx into a "paid scripts" business, and I don't "block people with Adblock". Every little bit of support helps.
Buy Me A Coffee Code Boxx eBooks
DONUT CHART DEMO
PURE HTML CSS DONUT CHART
All right, let us now get into the steps of building a simple donut chart using HTML and CSS only.
TUTORIAL VIDEO
PART 1) THE HTML
<!-- (A) DONUT CHART -->
<div id="donut"></div>
A <div id="donut"> container is all we need.
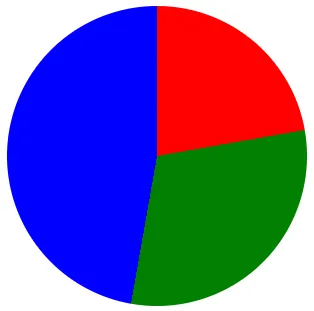
PART 2) PIE CHART
/* (A) PIE CHART */
#donut {
  /* (A1) CIRCLE */
  width: 300px; height: 300px;
  border-radius: 50%;

  /* (A2) SEGMENTS */
  background: conic-gradient(
    red 0deg 80deg,
    green 80deg 190deg,
    blue 190deg 360deg
  );
}
- (A1) Use
width: 300px height: 300pxto create a square, and addborder-radius: 50%to turn it into a circle. - (A2) Next, we specify the segments using
conic-gradient. As you already know, a full circle is 360 degrees. So we just specify the segments usingCOLOR START-DEGREE END-DEGREE.
Yes, I know. This is a pie and not a donut. Have some patience, we will get into that in the next step.
PART 3) DONUT CHART
/* (B) DONUT "CONVERSION" */
/* (B1) SMALLER CIRCLE */
#donut::before {
  content: "";
  width: 180px; height: 180px;
  border-radius: 50%;
  background: #fff;
}

/* (B2) "CONVERT PIE TO DONUT" - CENTER SMALLER CIRCLE */
#donut {
  display: flex;
  align-items: center;
  justify-content: center;
}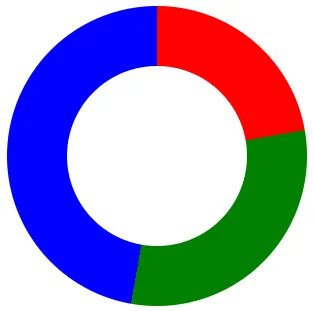
- (B1) We use the
::beforepseudo-class to create a smaller circle within the pie chart. - (B2) Then using CSS flex, center this smaller circle in the middle of the pie chart. This effectively “converts” the pie chart into a donut chart.
PART 4) THE LEGEND
4A) THE HTML
<!-- (B) LEGEND -->
<div id="legend">
  <div id="segment1"></div> <div>First</div>
  <div id="segment2"></div> <div>Second</div>
  <div id="segment3"></div> <div>Third</div>
</div>
Some other tutorials on the Internet do some “not-so-simple calculations” to put the labels/segments directly in the chart itself… I figured that is “too confusing”, and the easiest way is to create a separate legend.
4B) THE CSS
/* (C) LEGEND */
/* (C1) LEGEND CONTAINER */
#legend {
  display: flex;
  margin-top: 30px;
}

/* (C2) SEGMENTS */
#legend div { padding: 0 10px; }
#segment1 { background: red; }
#segment2 { background: green; }
#segment3 { background: blue; }
![]() Lastly, there is not much of a mystery here. The legend is just a simple “flexbox legend bar”.
Lastly, there is not much of a mystery here. The legend is just a simple “flexbox legend bar”.
EXTRAS
That’s all for the tutorial, and here is a small section on some extras and links that may be useful to you.
NOT GREAT FOR COMPLEX DONUTS
Of course, we can build simple donut charts using pure HTML and CSS. But when it comes to a complex multiple segments chart, it quickly becomes extremely painful with manual calculations and placements. So a little bit of Javascript to “automate” the calculation will do great – I shall leave that as a possible future update.
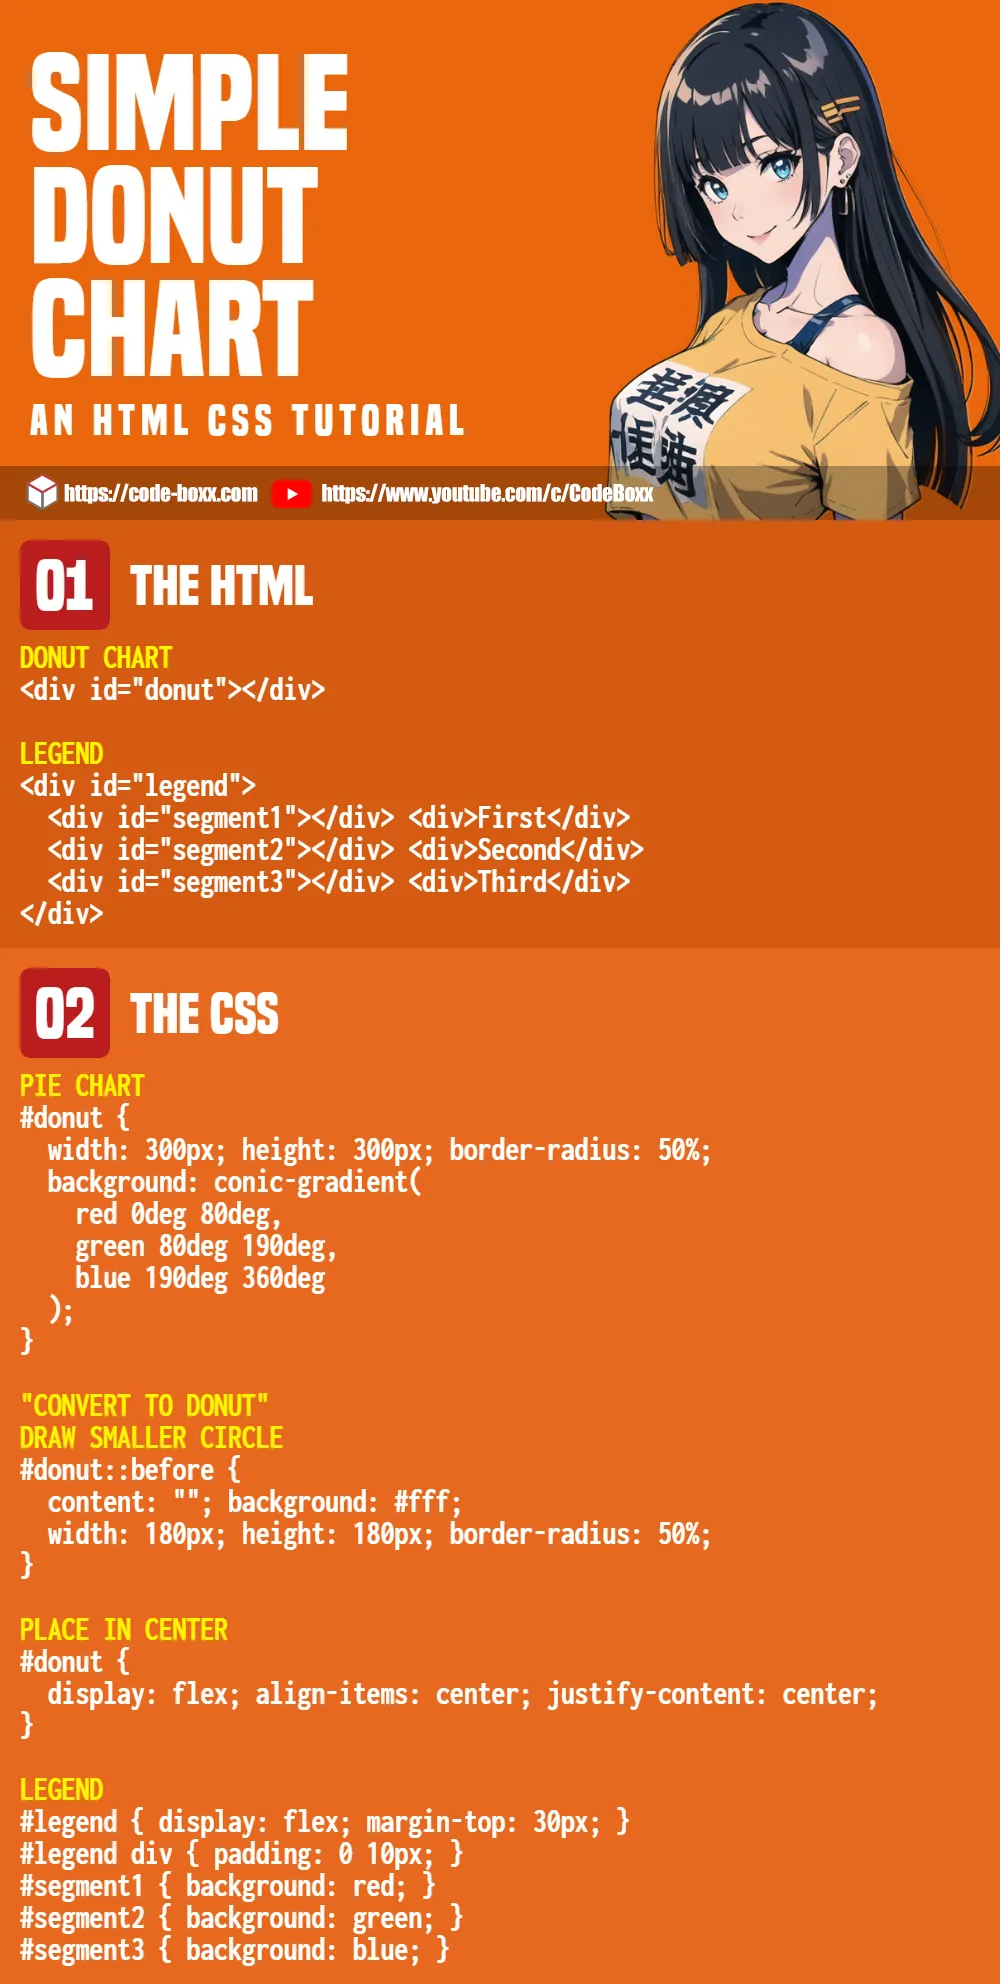
INFOGRAPHIC CHEATSHEET
COMPATIBILITY CHECKS
- CSS Flexbox – CanIUse
- CSS Conic Gradient – CanIUse
CSS flex and conic gradient are well-supported on all modern “Grade A” browsers.
LINKS & REFERENCES
- Javascript Pie Chart – Code Boxx
- HTML CSS Gantt Chart – Code Boxx
- HTML CSS Bar Chart – Code Boxx
- HTML CSS Pie Chart – Code Boxx
THE END
Thank you for reading, and we have come to the end. I hope that it has helped you to better understand, and if you want to share anything with this guide, please feel free to comment below. Good luck and happy coding!
Hi, this is so helpful thank u a lot!
I just would love to place the text in the middle of the hole.
Is there any possibility to do this?
Directly enter the text inside
<div class="hole">.Set both donut and hole to centered flex – B2
.donut, .hole { ... }Worked perfectly and satisfied my needs without requiring JavaScript. I’ve converted this into a Blazor component and can now use it whenever I need it. Thanks!