Welcome to a tutorial on how to create a simple pie chart using pure HTML and CSS. Need to display a simple pie chart in your project? But don’t want to introduce loading bloat with third-party libraries? Here’s a really simple version – Read on!
TABLE OF CONTENTS
DOWNLOAD & NOTES
Here is the download link to the example code, so you don’t have to copy-paste everything.
EXAMPLE CODE DOWNLOAD
Click here to download. I have released it under the MIT license, so feel free to build on top of it or use it in your own project.
SORRY FOR THE ADS...
But someone has to pay the bills, and sponsors are paying for it. I insist on not turning Code Boxx into a "paid scripts" business, and I don't "block people with Adblock". Every little bit of support helps.
Buy Me A Coffee Code Boxx eBooks
HTML CSS PIE CHART
All right, let us now get into the steps of building a simple pie chart using HTML and CSS only.
TUTORIAL VIDEO
PIE CHART DEMO
PART 1) PIE CHART
1A) THE HTML
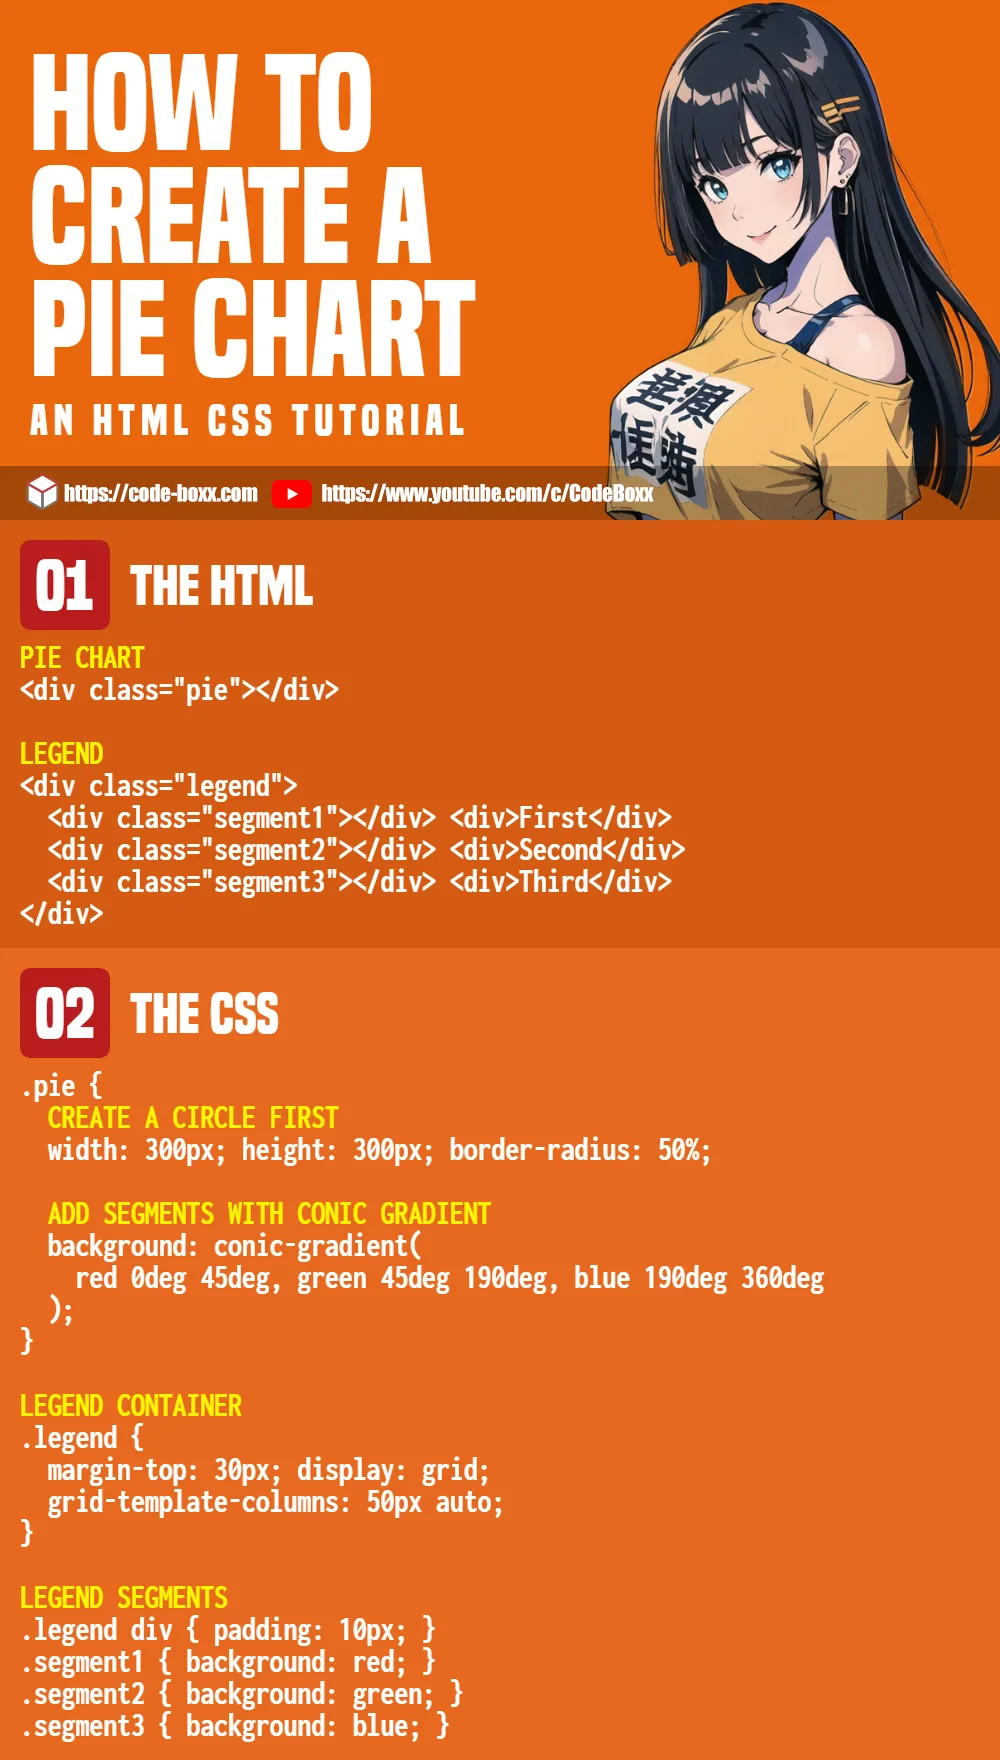
<!-- (A) PIE CHART -->
<div class="pie"></div>
Yes, a <div class="pie"> is all the HTML we need to generate the pie.
1B) THE CSS
/* (A) PIE CHART */
.pie {
  /* (A1) CIRCLE */
  width: 300px; height: 300px;
  border-radius: 50%;

  /* (A2) SEGMENTS */
  background: conic-gradient(
    red 0deg 45deg,
    green 45deg 190deg,
    blue 190deg 360deg
  );
}- (A1)
width: 300px height: 300pxwill create a square, and addingborder-radius: 50%turns it into a circle. - (A2) Build the segments using
conic-gradient, how it works is dreadfully simple. As you already know, a full circle is 360 degrees. So we just specify the segments usingCOLOR START-DEGREE END-DEGREE.
PART 2) THE LEGEND
2A) THE HTML
<!-- (B) LEGEND -->
<div class="legend">
  <div class="segment1"></div> <div>First</div>
  <div class="segment2"></div> <div>Second</div>
  <div class="segment3"></div> <div>Third</div>
</div>
Now, a few tutorials on the Internet do “brute force calculations” to put the labels/legend into the pie chart itself. I figured that is “not simple”, and the easiest way is to just create a separate legend.
2B) THE CSS
/* (B) LEGEND */
/* (B1) LEGEND CONTAINER */
.legend {
  display: grid;
  grid-template-columns: 50px auto;
  margin-top: 30px;
}

/* (B2) SEGMENTS */
.legend div { padding: 10px; }
.segment1 { background: red; }
.segment2 { background: green; }
.segment3 { background: blue; }
Not much of a mystery here either – The legend is just a “grid table”. The first cell is the “color block”, followed by the name of the segment itself.
EXTRAS
That’s all for the tutorial, and here is a small section on some extras and links that may be useful to you.
IT WORKS, BUT NOT FOR COMPLEX PIES.
This simple pie chart works great if you only have a few segments, but it quickly grows painful when there are a lot of segments to deal with. Manually calculating the segments, assigning the colors, and updating the legend is not fun to deal with… So a bit of Javascript to “automate” the calculation will be great – I shall leave that as a possible future update.
INFOGRAPHIC CHEATSHEET
COMPATIBILITY CHECKS
- CSS Grid – CanIUse
- CSS Conic Gradient – CanIUse
CSS grid and conic gradient are well-supported on all modern “Grade A” browsers.
LINKS & REFERENCES
- Javascript Pie Chart – Code Boxx
- Gantt Chart – Code Boxx
- Bar Chart – Code Boxx
- HTML CSS Donut Chart – Code Boxx
THE END
Thank you for reading, and we have come to the end. I hope that it has helped you to better understand, and if you want to share anything with this guide, please feel free to comment below. Good luck and happy coding!