Welcome to a tutorial on how to create a simple responsive bar chart in HTML and CSS. So you need to create a simple bar chart in your project? There’s no need to load complicated libraries, here’s how to create one yourself – Read on!
TABLE OF CONTENTS
DOWNLOAD & DEMO
Here is the download link to the example code, so you don’t have to copy-paste everything.
EXAMPLE CODE DOWNLOAD
Click here to download | Example on CodePen
Just click on “download zip” or do a git clone. I have released it under the MIT license, so feel free to build on top of it or use it in your own project.
SORRY FOR THE ADS...
But someone has to pay the bills, and sponsors are paying for it. I insist on not turning Code Boxx into a "paid scripts" business, and I don't "block people with Adblock". Every little bit of support helps.
Buy Me A Coffee Code Boxx eBooks
QUICK START & DEMO
<!-- (A) LOAD CSS + JS -->
<script src="3-bar-chart.js"></script>
<link rel="stylesheet" href="3-bar-chart.css">

<!-- (B) DIV TO GENERATE BAR CHART -->
<div id="demoA"></div>
<div id="demoB"></div>

<!-- (C) CREATE CHARTS -->
<script>
// (C1) HORIZONTAL BAR CHART
bchart.draw({
  type : "h",
  target : document.getElementById("demoA"),
  data: [
    ["First", 33],
    ["Second", 100],
    ["Third", 70]
  ]
});

// (C2) VERTICAL BAR CHART
bchart.draw({
  type : "v",
  target : document.getElementById("demoB"),
  data: [
    ["First", 33, "#4e0707"],
    ["Second", 100, "#077419"],
    ["Third", 70, "#124789"]
  ]
});
</script>
For you guys who just want to use this as a “plugin” without reading the rest of the tutorial:
- Load the Javascript and CSS. Captain Obvious at your service.
- Define a
<div>to create the bar chart. - Call
bchart.draw()to generate the bar chart.typeThe “orientation” of the chart.hfor horizontal andvfor vertical.targetTarget<div>to generate the chart in.dataArray of data to draw, in the format of[LABEL, QUANTITY, OPTIONAL COLOR].
RESPONSIVE BAR CHART
All right, let us now get into the details of the bar chart – This is for you guys who may want to learn or “deep customize” the charts.
TUTORIAL VIDEO
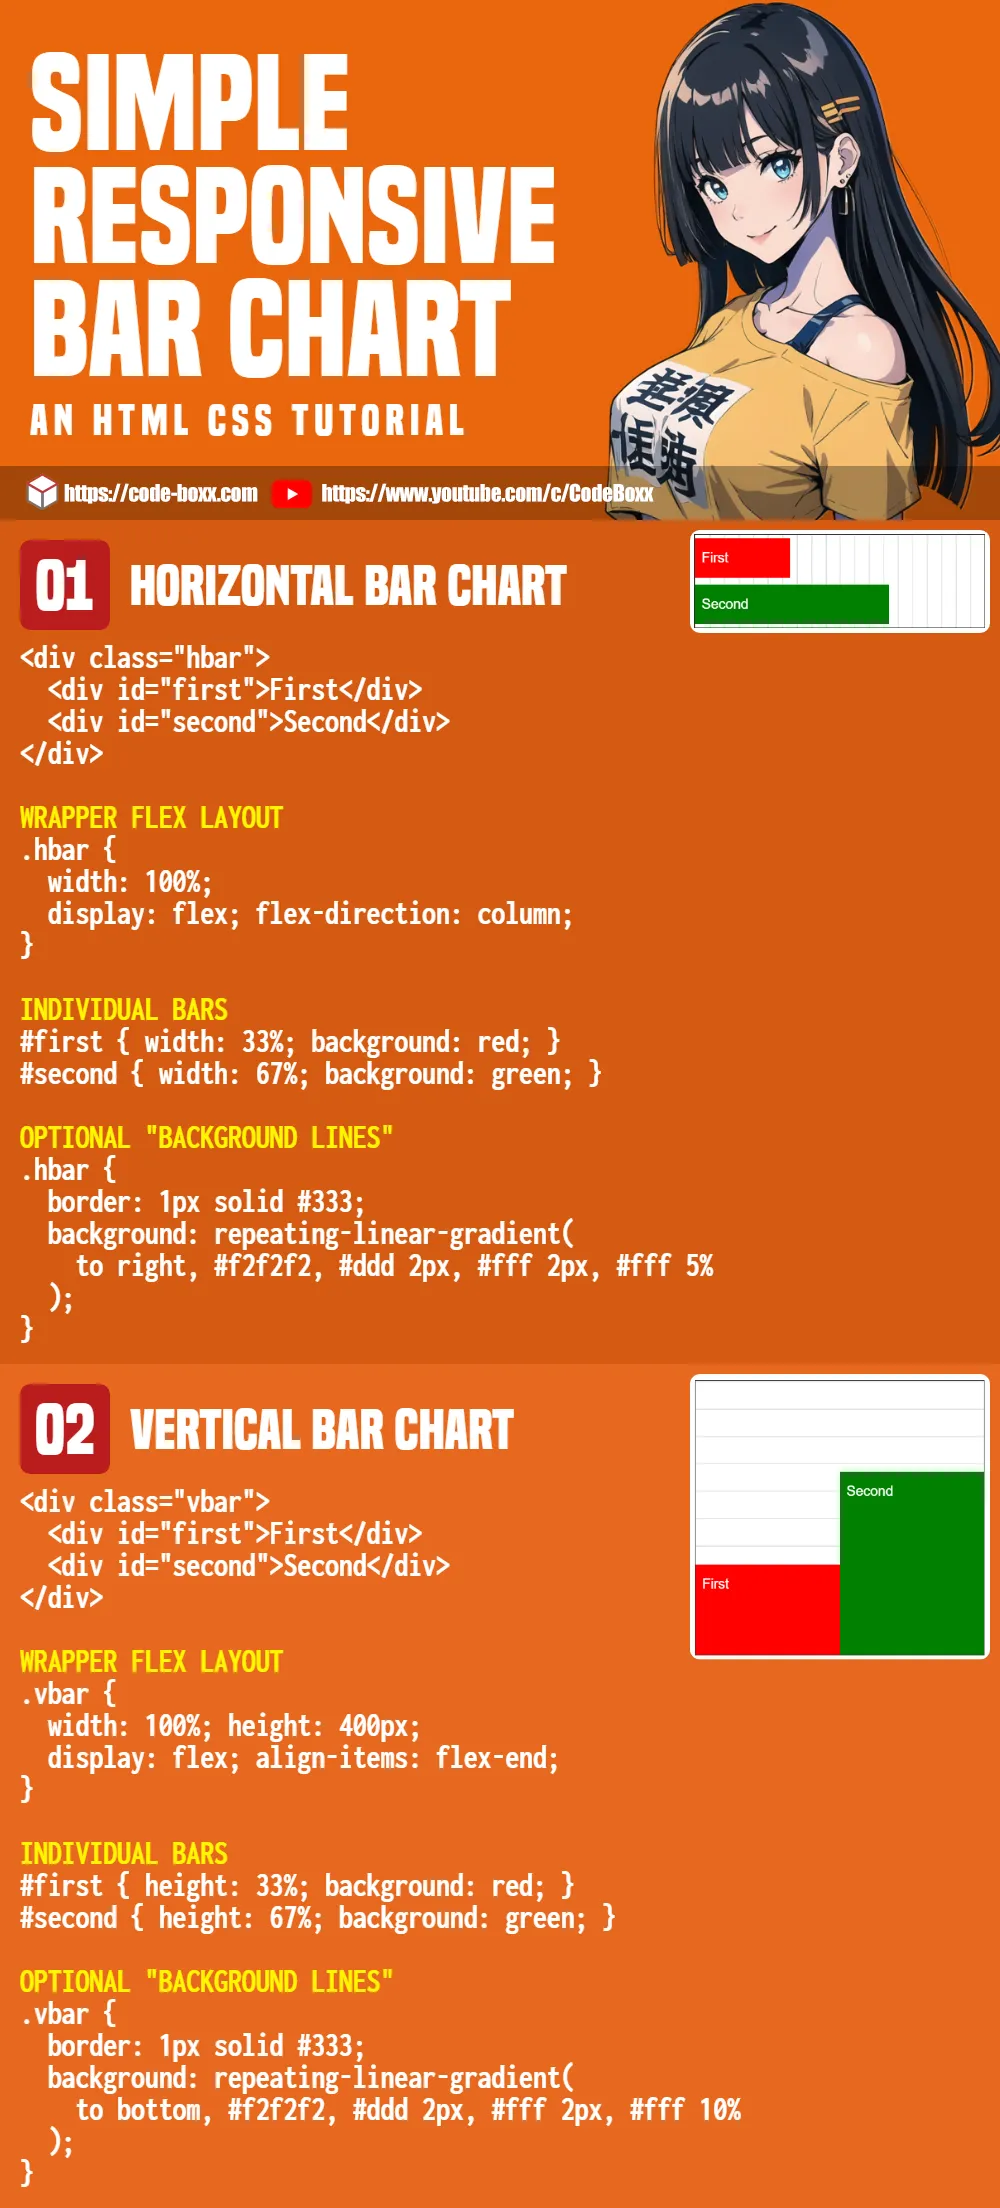
PART 1) HORIZONTAL BAR CHART
1A) THE HTML
<div class="hbar">
  <div id="first">First</div>
  <div id="second">Second</div>
</div>- Create a
<div class="hbar">wrapper. - Sandwich the “bars” inside –
<div id="first"> <div id="second">.
1B) THE CSS
/* (A) KEY MECHANICS */
/* (A1) WRAPPER FLEX LAYOUT */
.hbar {
  width: 100%;
  display: flex; flex-direction: column;
}

/* (A2) INDIVIDUAL BARS */
#first { width: 33%; background: red; }
#second { width: 67%; background: green; }Not kidding, that’s all we need to create a horizontal bar chart.
- Set the container to
display: flex. - Set the layout direction to
flex-direction: column, so the bars will be arranged from top to bottom. - Lastly, set a percentage width on the respective bars, and the background color.
PART 2) VERTICAL BAR CHART
2A) THE HTML
<div class="vbar">
  <div id="first">First</div>
  <div id="second">Second</div>
</div>
Look no further, it’s the same “bars in a wrapper”.
2B) THE CSS
/* (A) KEY MECHANICS */
/* (A1) WRAPPER FLEX LAYOUT */
.vbar {
  width: 100%; height: 400px;
  display: flex; align-items: flex-end;
}

/* (A2) INDIVIDUAL BARS */
#first { height: 33%; background: red; }
#second { height: 67%; background: green; }Slightly different CSS for the vertical bar chart.
- Set the container to
display: flexagain, but take note:- We have to give it a fixed
height. - Set
align-items: flex-end, so the bars will align to the bottom instead.
- We have to give it a fixed
- Lastly, set a percentage height on the respective bars, and the background color.
PART 3) BAR CHART WIDGET
var bchart = {
  // (A) HELPER FUNCTION - GENERATE RANDOM DARK COLOR
  // source: https://gist.github.com/Chak10/dc24c61c9bf2f651cb6d290eeef864c1
  rcolor : () => {
    let lum = -0.25, rgb = "#", c, i,
        hex = String("#" + Math.random().toString(16).slice(2, 8).toUpperCase()).replace(/[^0-9a-f]/gi, "");
    if (hex.length<6) { hex = hex[0] + hex[0] + hex[1] + hex[1] + hex[2] + hex[2]; }
    for (i=0; i<3; i++) {
      let n = i * 2;
      c = parseInt(hex.substring(n, n+2), 16);
      c = Math.round(Math.min(Math.max(0, c + (c * lum)), 255)).toString(16);
      rgb += ("00" + c).substring(c.length);
    }
    return rgb;
  },

  // (B) DRAW BAR CHART
  draw : instance => {
    // (B1) INIT CHART CONTAINER
    let horizontal = instance.type=="h";
    instance.target.classList.add(horizontal ? "hbar" : "vbar");
    instance.target.innerHTML = "";

    // (B2) GET LARGEST VALUE FROM DATA
    let largest = 0;
    instance.data.forEach(el => {
      if (el[1] > largest) { largest = el[1]; }
    });

    // (B3) DRAW CHART
    let bars = new DocumentFragment(), bar, percent;
    instance.data.forEach(el => {
      // (B3-1) CREATE <DIV> BAR
      bar = document.createElement("div");
      bars.appendChild(bar);

      // (B3-2) SET WIDTH/HEIGHT
      percent = Math.ceil((el[1] / largest) * 100) + "%";
      if (horizontal) { bar.style.width = percent; } else { bar.style.height = percent; }

      // (B3-3) BACKGROUND COLOR & TEXT
      bar.style.background = el[2] ? el[2] : bchart.rcolor();
      bar.innerHTML = el[0] + ": " + el[1];
    });
    instance.target.appendChild(bars);
  }
};
Now that you know how to create horizontal and vertical bar charts in HTML CSS, this Javascript will turn it into a “reusable widget”. It looks complicated, but keep calm and look closely. There are only 2 functions:
rcolor()A helper function to create a random dark background color.draw()As in the demo above, we call this to create a bar chart.- (B1) Simply add a CSS class to the wrapper, for horizontal
hbaror verticalvbarbar chart. - (B2) Get the largest value for the given dataset, we will use this to calculate the width/height percentage.
- (B3) Loop through the given dataset. Create the respective
<div>bar, set the width/height, and the color.
- (B1) Simply add a CSS class to the wrapper, for horizontal
EXTRAS
That’s all for this guide, and here is a small section on some extras and links that may be useful to you.
INFOGRAPHIC CHEATSHEET
COMPATIBILITY CHECK
- Arrow Functions – CanIUse
- Flex Layout – CanIUse
- Repeating Gradients – CanIUse
All the required features are well-supported in modern browsers, you will not run into compatibility issues.
LINKS & REFERENCES
- A Complete Guide to Flexbox – CSS Tricks
- Need more “professional charts”? Chart.js | Easy Pie Chart | Google Charts
THE END
Thank you for reading, and we have come to the end of this guide. I hope that it has given you some good ideas on how to create your bar charts, and if you have anything to add to this guide, please feel free to comment below. Good luck and happy coding!