Welcome to a tutorial on how to display an Excel file as an HTML table in Python Flask. So you want to read an Excel file and display it as an HTML table? Yes, it is actually not that difficult – Read on for the example!
TABLE OF CONTENTS
DOWNLOAD & NOTES
Here is the download link to the example code, so you don’t have to copy-paste everything.
EXAMPLE CODE DOWNLOAD
Just click on “download zip” or do a git clone. I have released it under the MIT license, so feel free to build on top of it or use it in your own project.
SORRY FOR THE ADS...
But someone has to pay the bills, and sponsors are paying for it. I insist on not turning Code Boxx into a "paid scripts" business, and I don't "block people with Adblock". Every little bit of support helps.
Buy Me A Coffee Code Boxx eBooks
EXCEL TO HTML TABLE
All right, let us now get into the example of reading an Excel file in Python and displaying it in an HTML table with Flask.
QUICK SETUP
- Create a virtual environment
virtualenv venvand activate it –venv\Scripts\activate(Windows)venv/bin/activate(Linux/Mac) - Install required libraries –
pip install openpyxl flask - For those who are new, the default Flask folders are –
staticPublic files (JS/CSS/images/videos/audio)templatesHTML pages
STEP 1) DUMMY EXCEL
| Jo Doe | jo@doe.com | 465785 |
| Joa Doe | joa@doe.com | 123456 |
| Job Doe | job@doe.com | 234567 |
| Joe Doe | joe@doe.com | 345678 |
| Jog Doe | jog@doe.com | 578456 |
| Joh Doe | joh@doe.com | 378945 |
| Joi Doe | joi@doe.com | 456789 |
| Jon Doe | jon@doe.com | 987654 |
| Jor Doe | jor@doe.com | 754642 |
| Joy Doe | joy@doe.com | 124578 |
For a start, here is the Excel file that we will be working with. Nothing special here… Just a list of dummy users.
STEP 2) FLASK SERVER
# (A) INIT
# (A1) LOAD MODULES
from flask import Flask, render_template, request, make_response
from openpyxl import load_workbook

# (A2) FLASK SETTINGS + INIT
HOST_NAME = "localhost"
HOST_PORT = 80
app = Flask(__name__)
# app.debug = True

# (B) DEMO - READ EXCEL & GENERATE HTML TABLE
@app.route("/")
def index():
  # (B1) OPEN EXCEL FILE + WORKSHEET
  book = load_workbook("S1_dummy.xlsx")
  sheet = book.active

  # (B2) PASS INTO HTML TEMPLATE
  return render_template("S3_excel_table.html", sheet=sheet)

# (C) START
if __name__ == "__main__":
  app.run(HOST_NAME, HOST_PORT)
The Flask server script is super straightforward once you trace through it.
- Load the required modules, and define the Flask settings; Python cannot read Excel files natively, and we will be using
openpyxl. Link to the full documentation is in the extras section below if you want to follow up. - Serve the “Excel to HTML” demo page – Open
S1_dummy.xlsx, select the required workbook and pass it into the HTML template. - Captain Obvious at your service. Start running the Flask server.
STEP 3) HTML TEMPLATE
<table id="demo">
  {% for row in range(1, sheet.max_row + 1) %}
  <tr>
    {% for col in range(1, sheet.max_column + 1): %}
    <td>{{ sheet.cell(row, col).value }}</td>
    {% endfor %}
  </tr>
  {% endfor %}
</table>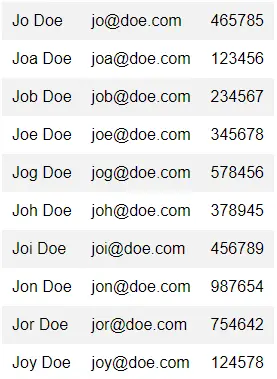
Don’t think this needs much explanation. We are just looping through the rows and columns of the Excel file to generate the HTML table.
EXTRAS
That’s all for the tutorial, and here is a small section on some extras and links that may be useful to you.
THE FIRST ROW IS THE HEADER
<table id="demo">
  <!-- HEADER ROW -->
  <thead><tr>
    {% for col in range(1, sheet.max_column + 1): %}
    <th>{{ sheet.cell(1, col).value }}</th>
    {% endfor %}
  </tr></thead>

  <!-- DATA ROWS -->
  <tbody>
  {% for row in range(2, sheet.max_row + 1) %}
  <tr>
    {% for col in range(1, sheet.max_column + 1): %}
    <td>{{ sheet.cell(row, col).value }}</td>
    {% endfor %}
  </tr>
  {% endfor %}
  </tbody>
</table>
Just draw the header row separately in the HTML template.
READING MULTIPLE SPREADSHEETS
@app.route("/")
def index():
  # (B1) OPEN EXCEL FILES + WORKSHEETS
  sheets = []
  for n in range(2):
    book = load_workbook("sheet"+str(n)+".xlsx")
    sheets.append(book.active)

  # (B2) PASS INTO HTML TEMPLATE
  return render_template("S3_excel_table.html", sheets=sheets)
Instead of a single worksheet, pass an array of multiple worksheets into the HTML template.
{% for sheet in sheets %}
<table id="demo">
  {% for row in range(1, sheet.max_row + 1) %}
  <tr>
  ...
Loop through each worksheet, and draw the HTML table.
LINKS & REFERENCES
- Display CSV As Table In Javascript – Code Boxx
- Display CSV As Table In Python Flask – Code Boxx
- openpyxl – A Python library to read/write Excel
- How to Read Excel File In Python – Linuxhint
THE END
Thank you for reading, and we have come to the end. I hope that it has helped you to better understand, and if you want to share anything with this guide, please feel free to comment below. Good luck and happy coding!
The code works fine but displays all the data causing the browser to crash for large data.
Is there a solution to this problem, such as replacing it, for example, with a search code?
There’s a limit called “system resources”, your best bet is called “don’t read everything at once” and “pagination”. Good luck!
It’s a really groundbreaking code.
I’d like to ask you two questions.
1. How should I proceed to display more than two Excels?
2. I tried to remove the nan value while proceeding with the above process, but I couldn’t read the data frame. Is there a solution?
Tutorial updated. See “READING MULTIPLE SPREADSHEETS” above.