Welcome to a short tutorial on how to measure the time taken to execute a query in MYSQL. So just how long did a query take to run in MYSQL? Which query is better and faster? There are several ways to measure and benchmark queries in MYSQL:
- The simplest way is to run the query in the command line, MYSQL is set to show the query execution time by default.
- Similarly, with tools like MYSQL Workbench and PHPMyAdmin, the execution time will be shown after running the query.
- Use MYSQL query profiling.
SET profiling = 1;- Run your statements.
SHOW PROFILES;
- Use the
BENCHMARK(LOOP, STATEMENT)function. - Manually write a test script to benchmark the performance of the query.
- Lastly, use a benchmarking tool such as Sysbench.
That covers the quick basics, read on for detailed examples!
TABLE OF CONTENTS
DOWNLOAD & NOTES
Here is the download link to the example code, so you don’t have to copy-paste everything.
EXAMPLE CODE DOWNLOAD
Just click on “download zip” or do a git clone. I have released it under the MIT license, so feel free to build on top of it or use it in your own project.
SORRY FOR THE ADS...
But someone has to pay the bills, and sponsors are paying for it. I insist on not turning Code Boxx into a "paid scripts" business, and I don't "block people with Adblock". Every little bit of support helps.
Buy Me A Coffee Code Boxx eBooks
MEASURING MYSQL QUERY TIME
All right, let us now get into the various ways and examples of getting the query execution time in MYSQL.
1) RUN QUERY IN MYSQL COMMAND LINE
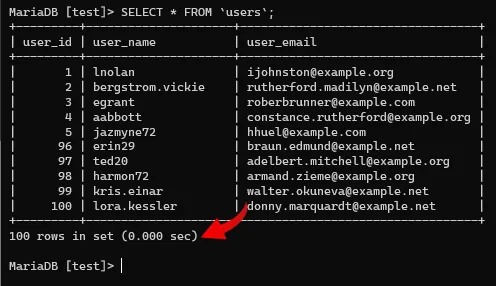
This is the simplest way to check a query execution time, without having to install anything. Just open the command line (or terminal), run MYSQL, and execute the SQL query. The time taken is set to be shown by default.
P.S. While simple, this may not be very useful. As you can see, most modern machines are so fast that it takes less than a split second to extract 100 entries. In such cases, I will recommend the profiling method below.
2) MYSQL TOOLS AND MANAGERS
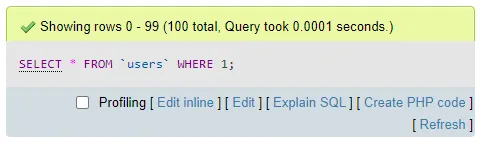
If you are using the “common MYSQL tools” such as MYSQL Workbench and PHPMyAdmin, both of them are also set to show the query execution time by default. No sweat.
3) MYSQL QUERY PROFILING
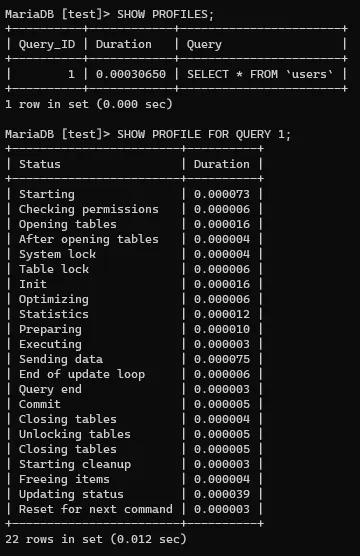
Some of you code ninjas may be thinking “I want to check for multiple queries”, and “I want more information”. Introducing MYSQL query profiling.
- Turn on the “profiling mode” with
SET profiling = 1. - Run all your SQL queries and statements as usual.
- Then
SHOW PROFILESto see how long each query takes. - You can also use
SHOW PROFILEandSHOW PROFILE FOR QUERY (Query ID)to see more details for the queries.
4) BENCHMARK FUNCTION
Again, some of you sharp code ninjas may be thinking “Running the query one time is not conclusive”. So yes, there is also a native MYSQL function for doing query benchmarking – BENCHMARK(LOOP, STATEMENT). For example, BENCHMARK(1000, 1+1) will run 1+1 1000 times, and return the average execution time.
But please take extra note, as indicated in the MYSQL manual itself – The BENCHMARK() function is meant for measuring scalar expressions. Meaning, the statement must return a single value. Testing SELECT queries such as BENCHMARK(1000, SELECT * FROM TABLE) will not work, since it returns multiple rows and columns. A big bummer, but there are other ways to benchmark SELECT queries.
5) MANUAL BENCHMARK SCRIPT
<?php
// (A) CONNECT TO DATABASE
$dbhost = "localhost";
$dbname = "test";
$dbchar = "utf8";
$dbuser = "root";
$dbpass = "";
$dbset = "mysql:host=$dbhost;dbname=$dbname;charset=$dbchar";
$pdo = new PDO($dbset, $dbuser, $dbpass);

// (B) TEST SETTINGS
$sql = "SELECT * FROM `users`";
$params = null;
$runs = 30000;

// (C) TIME QUERY
$start = microtime(true);
$stmt = $pdo->prepare($sql);
for ($i=0; $i<$runs; $i++) { $stmt->execute($params); }
$end = microtime(true);

// (D) CLOSE & RESULTS
$taken = $end - $start;
$average = $taken / $runs;
echo "TOTAL - $taken seconds | AVERAGE - $average seconds";
Following up with the above “average query speed”, we can write a simple test script to loop through the query multiple times. Then calculate the total time taken and the average per run.
P.S. This one is in PHP, but it can really be any other language that can connect to MYSQL… You can even write a stored function or procedure in “pure MYSQL” if you want.
6) USE A BENCHMARKING TOOL
Lastly, before the toxic trolls start to rage about “proper benchmarking” – Yes, there are a ton of database benchmarking tools. I am not going to list every single one here, but here is what the official MYSQL community recommends:
EXTRAS
That’s all for the tutorial, and here is a small section on some extras and links that may be useful to you.
LINKS & REFERENCES
- Measuring the Speed of Expressions and Functions – MYSQL
- Profiling – MYSQL
- How to Measure MySQL Query Time: A Detailed Look – Scalyr
THE END
Thank you for reading, and we have come to the end. I hope that it has helped you to better understand, and if you want to share anything with this guide, please feel free to comment below. Good luck and happy coding!